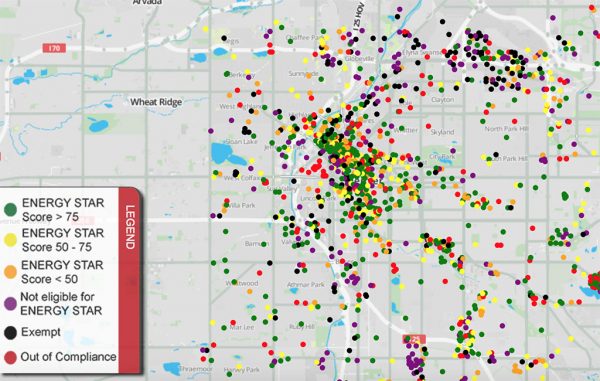
The City of Denver has released an online tool that shows how large buildings across the city rank when it comes to energy efficiency.
The Building Energy Performance Map displays Energy Star scores, which are on a 1-100 scale. A score of 50 is consistent with the national average for a building type.
The map draws from data collected following the City Council’s December 2016 approval of an ordinance requiring commercial and multifamily buildings in excess of 25,000 square feet to report annual energy performance.
The map displays scores for buildings greater than 50,000 square feet. Owners of those structures had to report their data by September 2017. The city said it had a 90 percent compliance rate.
Owners of the 3,000 Denver structures between 25,000 and 50,000 square feet have to start reporting energy performance by June 2018, according to the city.
There is no punishment for buildings with low scores. Owners that don’t submit data will be fined $2,000 per year.
High-scoring downtown buildings include The Denver Post building at 101 W. Colfax Ave. (97 out of 100), apartment complex Marq at RiNo at 2979 Wewatta Way (92) and office tower 1125 17th St. (92).
Buildings receiving lower scores include the Millennium Financial Center at 1550 17th St. (59) and the Boston Lofts at 828 17th St. (11).
The city said energy use from heating and cooling buildings is the largest source of greenhouse gases in Denver, accounting for 57 percent of its carbon emissions.
The city has set a goal to reduce greenhouse gas emissions by 80 percent of 2005 levels by 2050.
“Benchmarking the energy performance of a building is the first step toward understanding and reducing its energy consumption, which is directly tied to harmful emissions,” Katrina Managan, senior adviser with the Denver health department, said in a statement.


Leave a Reply